Skip to content
LUMING洛铭BIOMEDICAL DATA SCIENCE CONSULTING

SERVICE 01

Target and Indication Discovery from Public Data

Pan-cancer expression specificity, immune infiltration and pathway analysis from TCGA, ICGC, GEO and CCLE, plus Hi-C 3D genomics for GWAS variants.

When you need this

  • You have several candidate targets and need to decide which one to advance first.
  • The target is set, but the indication isn't, or you're looking for the next one.
  • You need target evidence with clear methods and traceable numbers before project initiation or licensing talks.
  • A GWAS hit sits in a non-coding region and you don't know which gene it regulates.

What these have in common: you want to read the public data carefully before committing lab resources.

METHODS

What we do

Data sources

  • TCGA (The Cancer Genome Atlas): tumor molecular data from more than ten thousand cancer patients, including matched normal tissue.
  • ICGC (International Cancer Genome Consortium), GEO (Gene Expression Omnibus) and CCLE (Cancer Cell Line Encyclopedia).

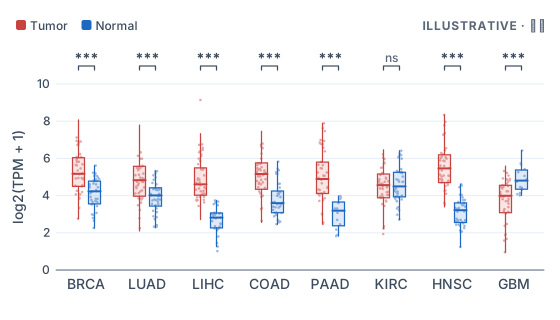
Target expression: tumor vs normal

Expression of a target in tumor versus normal tissue across 12 TCGA cancer types.

Illustrative box plot of a target's expression in tumor versus normal tissue across 12 TCGA cancer types (BRCA, LUAD, LIHC, COAD, PAAD, KIRC, STAD, HNSC, OV, PRAD, SKCM, GBM); expression is higher in tumor for most types. Synthetic data.
ILLUSTRATIVE · Not real client data

Analyses

  • Pan-cancer expression specificity: compare tumor and normal tissue for the same gene across many cancer types, to see whether it is elevated specifically in the one you care about.
  • Pathways and signatures: whether the target's pathway is active, and in which samples a related gene set moves up or down together.
  • Immune infiltration: how target expression relates to the immune cell composition of the tumor.
  • Hi-C / HiChIP 3D genomics: DNA is folded inside the nucleus, and Hi-C measures which stretches physically touch. We use it to link non-coding GWAS variants to the genes they actually regulate. A variant that sits far from a gene on the linear sequence can still be right next to it in 3D.

Signature-scoring methods compared

Seven methods × six cell types; dot size shows detection fraction, color shows mean score.

Illustrative dot plot comparing seven signature-scoring methods (VAM, scGSEA, GSVA, GSEA, GSDensity, CelliD, AUCell) across six cell types; dot size shows detection fraction, color shows mean score. Synthetic data.
ILLUSTRATIVE · Not real client data

Hi-C contact map and a GWAS locus

A non-coding GWAS SNP linked through chromatin loops at enhancers E1 and E2 to Gene A.

Illustrative triangular Hi-C contact map above a genome track, showing a non-coding GWAS SNP linked through chromatin loops at enhancers E1 and E2 to Gene A. Synthetic data.
ILLUSTRATIVE · Not real client data

DELIVERABLES

Deliverables

  • Target/indication evidence pack
  • Publication-grade figures
  • Reproducible scripts

If you need standardized reports across several targets in one format, see the Target–Indication Evidence Pack.

QUESTIONS WE HEAR

Questions R&D teams bring us

"Of our three candidate targets, which shows the largest tumor-versus-normal difference with the lowest expression risk in normal tissue?"

"The target is set. Which cancer type should be our second indication, and on what evidence?"

"Our GWAS risk locus is non-coding. Which gene does it actually regulate?"

Start with one question

Tell us the target or indication you're looking at. In a free 30-minute consultation, we'll tell you how far public data can take it.